You launched an ad campaign. Money is being spent, time is passing, but there are zero sales. Sound familiar? In moments like this, it’s tempting to hit “Pause” and conclude: “Advertising just doesn’t work for my business.”
However, in 70% of cases, the problem has nothing to do with bad ad copy or targeting options. Your ads could be virtually flawless, yet sales still won’t come through. Let’s break down step-by-step how to pinpoint the real bottleneck and determine what actually needs fixing: your ads, your website, or your sales team.
Where to Start: Is There Actual Demand?
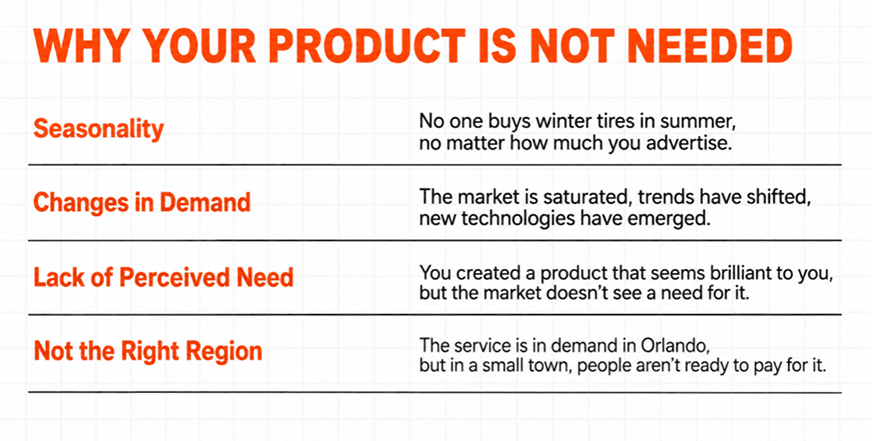
Before tweaking ad settings, redesigning your website, or auditing your sales reps, ask yourself one honest question: Do people actually want your product right now?
There are situations where the ads are optimized, the landing page looks incredible, and sales reps follow up instantly—yet sales remain at zero simply because there is no market demand for the offer.
Why Is Performance Forecasting Essential for Business?
Understanding your potential audience reach and costs upfront keeps you from burning through cash. When you know expected cost benchmarks and potential returns ahead of time, you avoid unexpected budget drain.
In search advertising, building a media plan or forecast involves gathering historical search data to predict outcomes. Using tools like Google Ads Keyword Planner or Performance Planner, you can estimate traffic volume, required ad spend, lead counts, and average cost-per-lead (CPL) within a reasonable margin of error.
Why is forecasting essential for business?
• Targeted Budget Allocation: Spend money strictly where buying intent exists.
• Realistic Sales Planning: Base targets on actual search volume rather than guesswork.
• Strategic Focus: Multi-offer businesses can identify which product line offers the highest return on ad spend (ROAS).
The Main Mistake: Evaluating Ads Solely by Sales
Many business owners assume that advertising equals sales: you launch a campaign, put money in, and leads or customers immediately roll out the other end. It feels logical—you paid for ads, so you expect revenue.
In reality, digital ads rarely close a deal on their own. An ad’s job is to grab attention, generate interest, and drive a user to your landing page. From there, the buyer’s journey consists of several distinct stages:

Evaluating campaign performance only by the final step leads to wasted budget. If a breakdown occurs at any point along this chain, you won’t get the sale. The goal is to identify the broken link.
Step 1. Check Your Traffic
First, log into your advertising manager and look at the core metrics.
1. Where to Look
• Google Ads: Log into your account and check your Campaign overview. For deeper analysis, go to the Reports tab or use the Search Terms / Audiences reports.
• Meta Ads (Facebook & Instagram): Access Meta Ads Manager. Check performance at the Campaign, Ad Set, and Ad levels via the customized columns dashboard.
2. Key Metrics to Inspect
• Clicks: Are people actually clicking on your ads? Zero or single-digit clicks over several days indicates a clear bottleneck.
• Cost Per Click (CPC): Your primary traffic cost metric.
• Performance Trends: Compare metrics over the last 2–3 days. If traffic drops while the budget stays constant, competitor bids may have increased, or ad creative fatigue may have set in.
Takeaway:
• No Clicks (Low Impressions / High CPC): The issue is in the advertising (targeting, ad creative, messaging, or keywords need adjustment).
• Consistent Clicks (Traffic Flowing): The ad did its job—move to the next stage of the funnel.
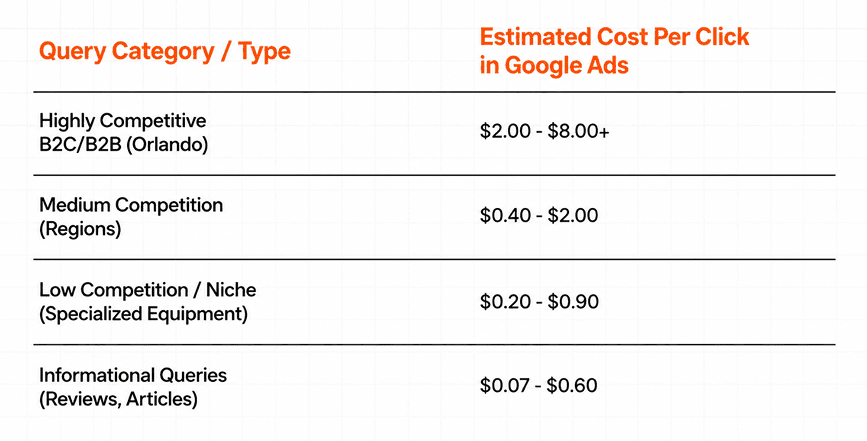
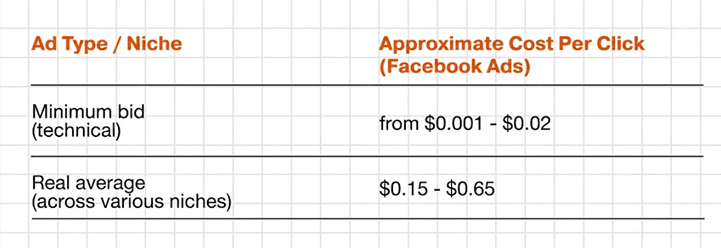
What Is a “Normal” Cost Per Click?
There is no universal benchmark for CPC. It can vary significantly based on industry, geographic targeting, and platform competition. However, search ads (Google Ads) generally target high-intent buyers and command higher CPCs, while social media ads (Meta Ads) often deliver lower CPCs but require more nurture to convert into sales.
Step 2. Analyze On-Site User Behavior
If your ads are driving visitors to your site, the next step is examining what happens after they arrive. If users leave almost instantly, your budget is burning—not necessarily because of bad ads, but likely because of landing page issues.
Where to Track User Behavior
You will need website analytics tools installed on your site:
• Google Analytics 4 (GA4): The industry standard for tracking user engagement, traffic sources, and event conversions.
• Session Recording & Heatmap Tools: Third-party platforms like Microsoft Clarity, Hotjar, or Lucky Orange.
Key Engagement Metrics to Protect Your Budget
1. Bounce Rate / Engagement Rate
In GA4, an unengaged session (a bounce) occurs when a user spends less than 10 seconds on the page, doesn’t trigger a conversion event, and views only one page.
• Standard Benchmark: 20%–40% for landing pages; 25%–45% for multi-page e-commerce stores.
• Critical Warning: Bounce rates above 60%–70%. This means over half of your paid traffic leaves without engaging.
• Common Cause: Message mismatch between the ad promise and page headline, slow page load speeds, or poor mobile formatting.
2. Average Engagement Time
The actual duration users spend interacting with your content.
• Standard Benchmark: 1.5 to 3 minutes.
• Critical Warning: Under 30–40 seconds. Visitors are failing to find relevant information or quickly losing interest.
• Common Cause: Unclear value proposition, weak page hierarchy, or unhelpful copy.
3. Pages Per Session
The average number of pages viewed per visit.
• Standard Benchmark: 1.1–1.5 for single-page landing pages; 3–5 for multi-page e-commerce or directory sites.
• Critical Warning: 1.0 on a complex e-commerce site (indicates users exit from the entry page).
• Common Cause: Confusing navigation, broken internal links, or weak calls to action (CTAs).
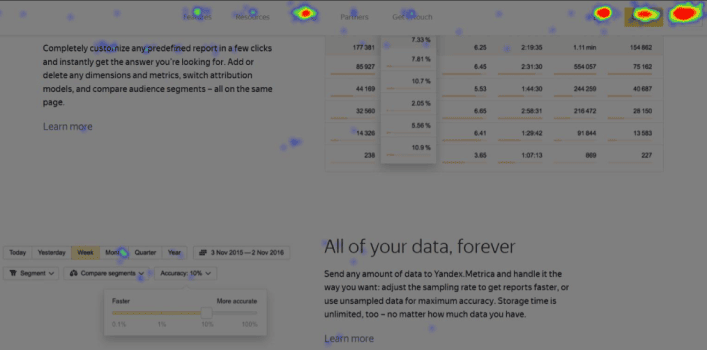
4. Scrollmaps (via Microsoft Clarity or Hotjar)
Scrollmaps visualize how far down the page users scroll before dropping off. Identify where the drop-off occurs. If most visitors abandon the page before reaching your pricing, testimonial, or order form sections, move those elements higher up the page (above the fold).
5. Heatmaps & Click Tracking
Heatmaps show where users tap or click. Compare actual clicks against intended actions. Users should be clicking primary CTAs (“Get a Quote”, “Buy Now”). If they are clicking non-clickable elements (like static images or plain text), adjust your UI design to make visual cues intuitive.
Takeaway: If ads bring traffic but users exit quickly without converting, your ads are doing their job, but your landing page is failing to convert. Fix the landing page before touching the ad budget.
Step 3. Evaluate Lead Volume and Quality
Don’t judge performance purely by whether you got some inquiries. The critical question is: What is the quality of these leads, and are they predictable? Ten unqualified inquiries that never buy are worthless compared to 3 to 5 highly targeted, sales-ready prospects.
Establishing Conversion Rate Expectations
To evaluate lead volume, look at standard industry conversion rates (visitors to leads):
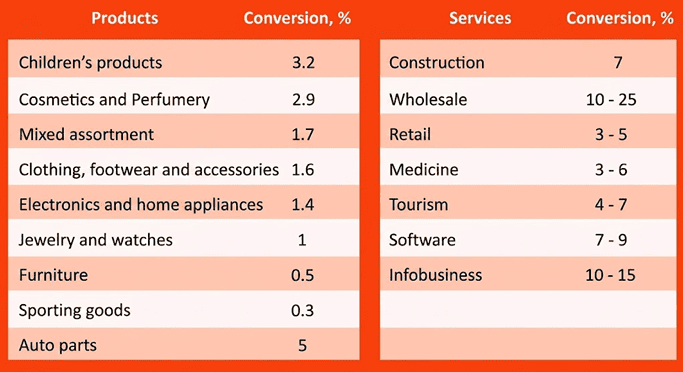
Example: If 100 targeted visitors land on your page daily and your conversion rate is 3%, you should generate roughly 3 leads daily. Getting 0 to 1 lead indicates a breakdown in the offer or form experience.
Why Lead Volume Falls Short
• Ad-to-Page Mismatch: An ad promises “20% Off Your First Order,” but the landing page makes no mention of the discount.
• Incorrect Destination URL: The ad highlights a specific service, but links to a generic homepage.
• High Friction Forms: Asking for too much information upfront, requiring immediate account creation, or triggering invasive pop-ups.
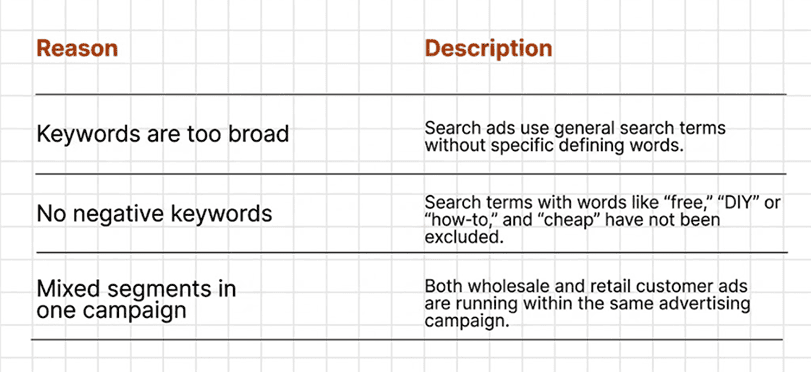
Scenario A: You Get Leads, But They Are Unqualified
Your form submissions are active, but the leads aren’t viable.
• Inquiries come from locations outside your service area.
• Prospects have budgets far below your minimum threshold.
• Leads ask about services you do not offer.
Diagnosis: Ads are driving traffic, but reaching the wrong target demographic. The marketing channel works, but ad targeting, copy filters, or positioning need adjustment.
Scenario B: “Price-Checkers” Who Ghost
Prospects ask “How much is this?” or “Can I get info?” and then disappear.
Diagnosis: The ad and landing page lack clarity. If pricing guidelines, qualifications, or service scope are completely hidden, you attract information gatherers rather than ready-to-buy decision-makers.
Lead Audit Framework
Break down incoming leads systematically:
- Response Rate: How many leads are successfully contacted without falling into spam or missed calls?
- Qualification Rate: How many contacts fit your Ideal Customer Profile (ICP) and receive a proposal/quote?
- Close Rate: How many quotes turn into signed deals or closed sales?
If only 1 out of 10 leads is qualified, the core issue is traffic quality and offer positioning—not raw traffic volume.
Step 4. Audit Your Sales Process
This is where technical marketing analysis ends and human execution takes over.
You can have optimized campaigns, a high-converting landing page, and steady lead volume, yet zero revenue if leads are mishandled after submission.
The Mystery Shopper Test
Test your own system: submit a lead as an anonymous buyer through every available channel (form, live chat, phone, social inbox).
- Speed to Lead: In digital marketing, immediate response is critical. Reaching out within the first 5 minutes yields the highest contact and conversion rates. Waiting hours or days often means the prospect has already hired a competitor.
- Communication Quality: Did the representative introduce themselves, ask qualifying questions, and clearly explain value? Or was the response cold, scripted, or unprepared?
- Pipeline Management: Was the contact properly entered into your CRM, followed up on, and sent clear next steps?
Takeaway: Business owners often pause profitable ad campaigns believing “ads don’t work,” when in reality, valid leads were simply lost or ignored during the sales process.
Step 5. Unit Economics
Marketing analysis is incomplete without auditing unit economics. Even with steady leads and strong sales execution, a business can still lose money if the underlying acquisition math is flawed.
The 3 Core Metrics You Must Calculat
Cost Per Lead (CPL)
The total ad spend required to generate one inquiry/lead.
Example: Spend $1,000 on Google Ads, receive 100 leads
Lead-to-Sale Conversion Rate (CR)
The percentage of leads that become paying customers.
Example: 20 sales out of 100 leads CR = 20%
Average Order Value (AOV) / Customer Value
The average revenue generated per paying customer.
Example: $6,000 revenue from 30 buyers AOV = $200
Combining Metrics: Customer Acquisition Cost (CAC)
Calculate your true Customer Acquisition Cost (CAC) (also referred to as Cost Per Acquisition / CPA) using your CPL and sales conversion rate:
Example:
• CPL = $10
• Sales CR = 20% (0.20)
You spend $50 in ad spend to acquire one paying customer.
Assessing Profitability
Compare your CAC against your Average Order Value and gross margins:
Example A (Healthy Unit Economics):
• AOV = $200
• CAC = $50
• Gross Margin before overhead = $150
(After factoring in product/service costs, fulfillment, and operating expenses, the acquisition cost leaves sustainable profit.)
Example B (Flawed Unit Economics):
• AOV = $15
• CPL = $10
• Sales CR = 20% (0.20)
• CAC = $50
(You spend $50 on marketing to sell a $15 product. This model generates a net loss on every transaction regardless of scale.)
How to Fix Negative Unit Economics
- Lower CPL: Optimize ad targeting, improve click-through rates (CTR), or refine keyword match types.
- Increase Conversion Rates: Refine landing page copy, remove form friction, and implement structured sales follow-up scripts.
- Raise Average Order Value (AOV): Introduce product bundles, upsells, cross-sells, or premium service tiers.
If unit economics remain negative after optimization, advertising that specific offer on that channel is economically unviable. Identifying this early prevents draining capital.
Conclusion
When sales stall, the simplest reaction is to blame advertising, turn off campaigns, and hope a different agency or platform magically fixes the issue.
However, advertising is simply the front door. Performance ultimately depends on landing page experience, lead handling, sales follow-up, and sustainable unit economics.
Before turning off your ads, complete this diagnostic checklist:
- Check Traffic: Are ads generating clicks at a competitive CPC?
- Analyze On-Site Behavior: Are users staying on the page or bouncing immediately?
- Evaluate Lead Quality: Are you receiving qualified inquiries or random price-checkers?
- Audit Sales Execution: Are leads contacted within 5 minutes and tracked inside a CRM?
- Calculate Unit Economics: Does your CAC leave room for net profitability after COGS and overhead?
In the majority of cases, the bottleneck lies somewhere down the funnel rather than inside the ad platform itself. Fixing the true constraint protects your traffic flow and fixes the real revenue bottleneck.
Schedule free marketing consultation
Learn how to stop wasting ad spend and turn marketing into real profit